

Getting to know your customer is what separates the losers from the winners in the SaaS world.
Every successful business has a strong understanding and ability to around their
needs.
SAAS stands for “software as a service” and there are dozens of details to consider when reporting on key marketing and sales data for SaaS organizations.
Obviously, these metrics can be applied across all industries and company types and should be monitored on a regular basis. It’s important to put in place necessary reports and set benchmarks for each. Start by looking into your last year or quarter’s data to set a baseline to measure against, and use that baseline to evaluate if you’re growing — or stagnating — in the coming months.
Below there are key metrics as a bible for every SAAS sales and customer support team.
Monthly Recurring Revenue (MRR) is the amount of revenue that a company receives on a monthly basis. MRR is critical to understanding overall business profitability and cash flow for subscription companies. Once you’ve calculated the MRR for each customer, you can calculate the total MRR for your business.
MRR breakdowns are always helpful to look at your revenue growth. There are main 4 parts to divide your MRR and see an overall view of your business.
New MRR
New MRR is the monthly recurring revenue that’s generated from brand new customers. If you have 5 new customers in a month, they pay $100/month and the other your new MRR would be $500.
Expansion MRR
Monthly recurring revenue from your existing customers such as upgrade as a result of an upsell or cross-sell.
If 5 of your customers upgrade their subscription from $100 to $200/month, the expansion MRR would be $1000.
Contraction MRR
Contraction refers to the revenue lost from existing customers who have downgraded their subscriptions and takes into account both downgrade MRR and Churn.
Churn MRR
Churn MRR is the amount of monthly recurring revenue lost due to customer cancellations. It’s often calculated against MRR to see Churn MRR amount.
It’s often calculated against MRR to see Churn MRR and monitor the impact on business.
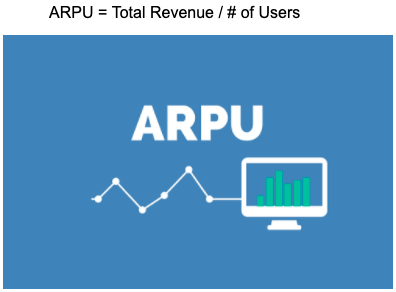
ARPU is known as average revenue per user and it is equivalent to total revenue, besides being very useful for all types of businesses, it’s most commonly used to analyze subscription-based organizations.
ARPU calculation is a great way for a business to track growth progress.
Calculating business ARPU is quite easy, It is simply taking the total revenue divide into a number of users in a given time period.
Starting with telecommunication companies such as AT&T, Verizon, and followed by cable companies such as Comcast, and nowadays on the scene for social media companies like Facebook, which is not subscriber-based.
Facebook’s average revenue per user in the third quarter of 2020 was $7.89.
Definition of a standard time period is a must. Most Saas companies calculate ARPU on a month-to-month basis. The total revenue generated during the standard time period should then be divided by the number of units or users.
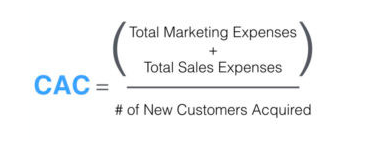
Customer acquisition cost is the best estimate of the total cost of acquiring a new customer. It should usually include things like advertising costs, your marketers’ salary, your salesperson’s costs, etc. Divided by the number of customers gained.
It is a really useful number that will help you calibrate your investment and make sure you are making the right decisions for your growth.
Why is it important? If your customer acquisition cost is more than your income for a long enough period of time, you will be out of business.
An even better way to use CAC: Match with customer lifetime value (CLTV)
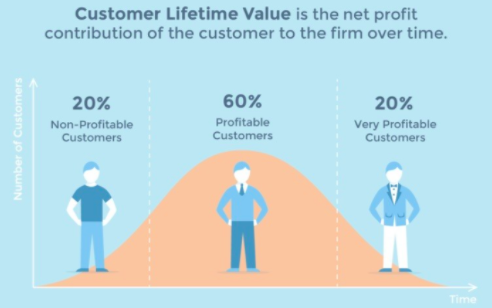
Lifetime customer value (Customer lifetime value, or CLV) is the expected sum of all revenues a customer will generate for your business.
CLTV tells you how valuable a single customer is to your brand and gives you an idea of its overall value. This helps you understand how much you need to invest to keep the customer.
It is most cost-effective to increase your income from an existing customer than to acquire new customers. For this reason, you are expected to have a higher probability of success in business models and scenarios with higher lifelong customer value.
CLTV can be mentioned as the loyalty of customers to your product or services. You can find some tips to increase your CLTV.
The conversion rate is the number of conversions divided by the total number of visitors. It can be an e-commerce website or subscription-based SaaS.
You are monitoring 100 visitors on an average per day. And out of these, about 20 people buy your product or service daily. So your conversion rate, which is the ratio of people becoming your customers to the total number of visitors on your website, is about 20%.
A conversion can refer to any desired action that you want the user to take. This can include anything from a click on a button to making a purchase and becoming a customer.
Customer Churn
Maintaining the existing customers is equally important as driving new customers to your business. It is one of the most important metrics in tracking the vitality of your business.
Customer churn measures the rate at which customers cancel their subscription to your service. It can give you a better understanding of customer retention by specific insight on activity across specific time periods.
When tracking churn, be sure to identify the personas of these churned customers as well as the industries that can help to light on why they failed to renew.
Customer churn indicates how good you are at retaining existing customers.
Revenue Churn
Alongside customer churn, every SaaS companies have to measure revenue churn to evaluate the outside impact.
Revenue Churn is used to looking at the rate of monthly recurring revenue (MRR) is lost as a result of churned customers and downgraded subscriptions.
Some customers may be generating more revenue than others if the subscription price is depending on variables such as users, additional tools, or features, the customer churn rate might be different than the revenue churn rate.
Revenue churn indicates how good you are at retaining customer revenue.
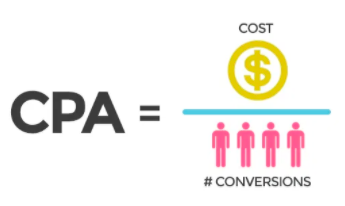
Cost for every action. Targeted action is usually charged on a fixed or percentage basis. CPA is one of the most favourite metrics of marketers. Cost per action is a digital advertising payment model that allows charging an advertiser only for a specified action taken by a prospective customer.
All actions covered by the model are directly related to some type of conversion, ranging from a newsletter sign up to a link click or sale and determined by the advertiser.
CPA is calculated by dividing Total Cost by the Total Number of Actions.
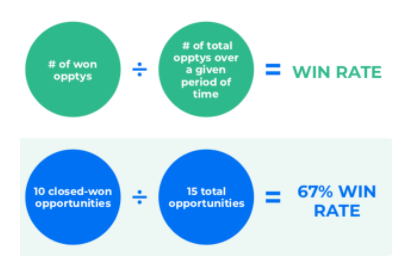
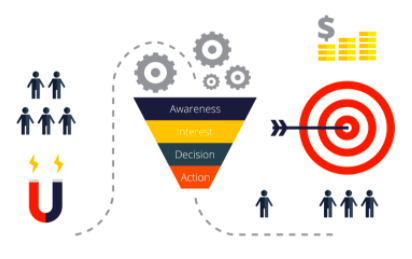
One of the critical elements in determining your sales velocity is your Win Rate. Win rate is the percentage of prospects that became customers divided by the total number of opportunities in the pipeline.
If you don’t know how many opportunities to pursue it is hard to build a sales strategy or know what marketing needs to deliver into the funnel.
In this case, the results of the four sales cycles are as follows:
Deal A and Deal B are won, and Deal C and Deal D are lost. Win two. Lose two. That is a 50% Win Rate.
However, when we look at the values of the deals, the result becomes drastically different. A and B valued at $30,000, where C and D together to a value of $70,000. On a value basis, your win rate is 30%.
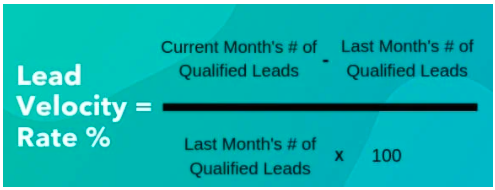
The lead velocity rate calculates the real-time growth of qualified leads month over month. It’s one of the most important metrics to predict future revenue.
Lead velocity rate measures the efficiency and effectiveness of the company’s sales pipeline. LVR is one of the most critical key performance indicators (KPIs) of SaaS companies. Generally, companies use lead velocity rate to assess the efficiency of its sales, as well as its growth potential.
Lead velocity rate is calculated as a percentage change in the number of qualified leads in the present month relative to the previous month.
“hit your LVR goal every month… and you’re golden. And you’ll see the future of your business 12-18 months out, clear as can be.”
Jason Lemkin, SaaStr
Marketing Qualified Leads
Prospects, that they can be customers with their interactions on the website or other channels, and they show interest in the content you offer (template, white book, presentation, report … etc.). For example; You can fill out a web form on your website, download content from your website, or subscribe to a newsletter.
Each of the interactions is considered as a metric and helps determine where the visitor is in the purchasing cycle.
Sales Qualified Leads
SQL is a potential customer that has an interest in your service or product, already met the criteria for MQL, and going forward has shown a high likelihood of purchasing by offering a trial, demo, and special solutions to the MQLs at the decision stage.
Customers in this group; are those who have high lead scores and come to the contract stage, they must be followed carefully to be turned into customers.
Product Qualified Lead
PQL is more likely to return to a sale than MQL and the sales cycle is shorter.
PQL is not the same as MQL, PQLs is based on using the product and experiencing your product through the free trial version.
Lead Scoring
Lead scoring is a common sales and marketing term for ranking leads in order to determine their sales-readiness. You can score leads based on the interest they show in your business, their current place in the buying cycle, and their fit in regards to your business.
Lead scoring is to identify which leads are ready to move to sales and which leads require further nurturing. No lead should be left behind.
We will get in touch with you shortly